Great Election Maps
We are so used to seeing the geographic map color coded per election results. Did you ever wonder how those colored blue could win when there seems to be so much more red? This is because the geographic map does not accurately depict the real numbers being used. Our elections are not based on the size of the state, nor the population. Elections are won based on the number of Electoral Votes that exist for that State.
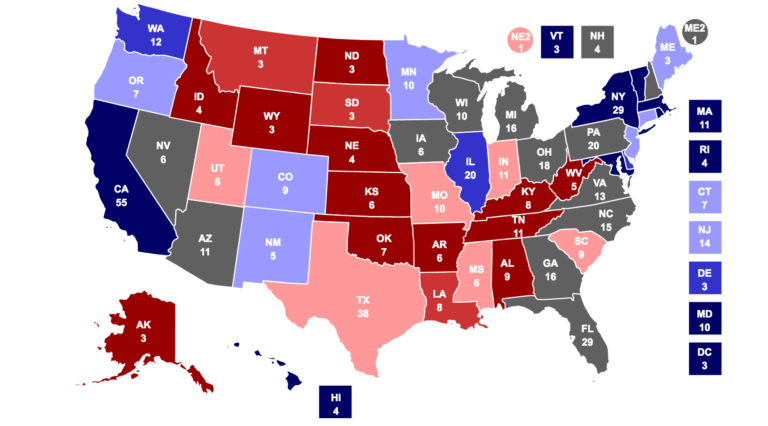
Take Montana as an example. It is a large state and is colored red. Compare that with Washington which is blue. Using the map above, a person would see more red than blue, giving the impression that Montana means more than Washington. However, Washington carries twelve (12) Electoral Votes while Montana only carries three (3).
 This is why we are starting to see Electoral based maps, like the one above. The geometry is altered to fit the Electoral Vote sizes appropriately.
Click the links below to view some interactive Electoral based maps. Don't forget to vote!
Wall Street Journal Electoral Map
Washington Post Electoral Map
Take Montana as an example. It is a large state and is colored red. Compare that with Washington which is blue. Using the map above, a person would see more red than blue, giving the impression that Montana means more than Washington. However, Washington carries twelve (12) Electoral Votes while Montana only carries three (3).

Click the links below to view some interactive Electoral based maps. Don't forget to vote!
Wall Street Journal Electoral Map
Washington Post Electoral Map
Comments
Post a Comment